
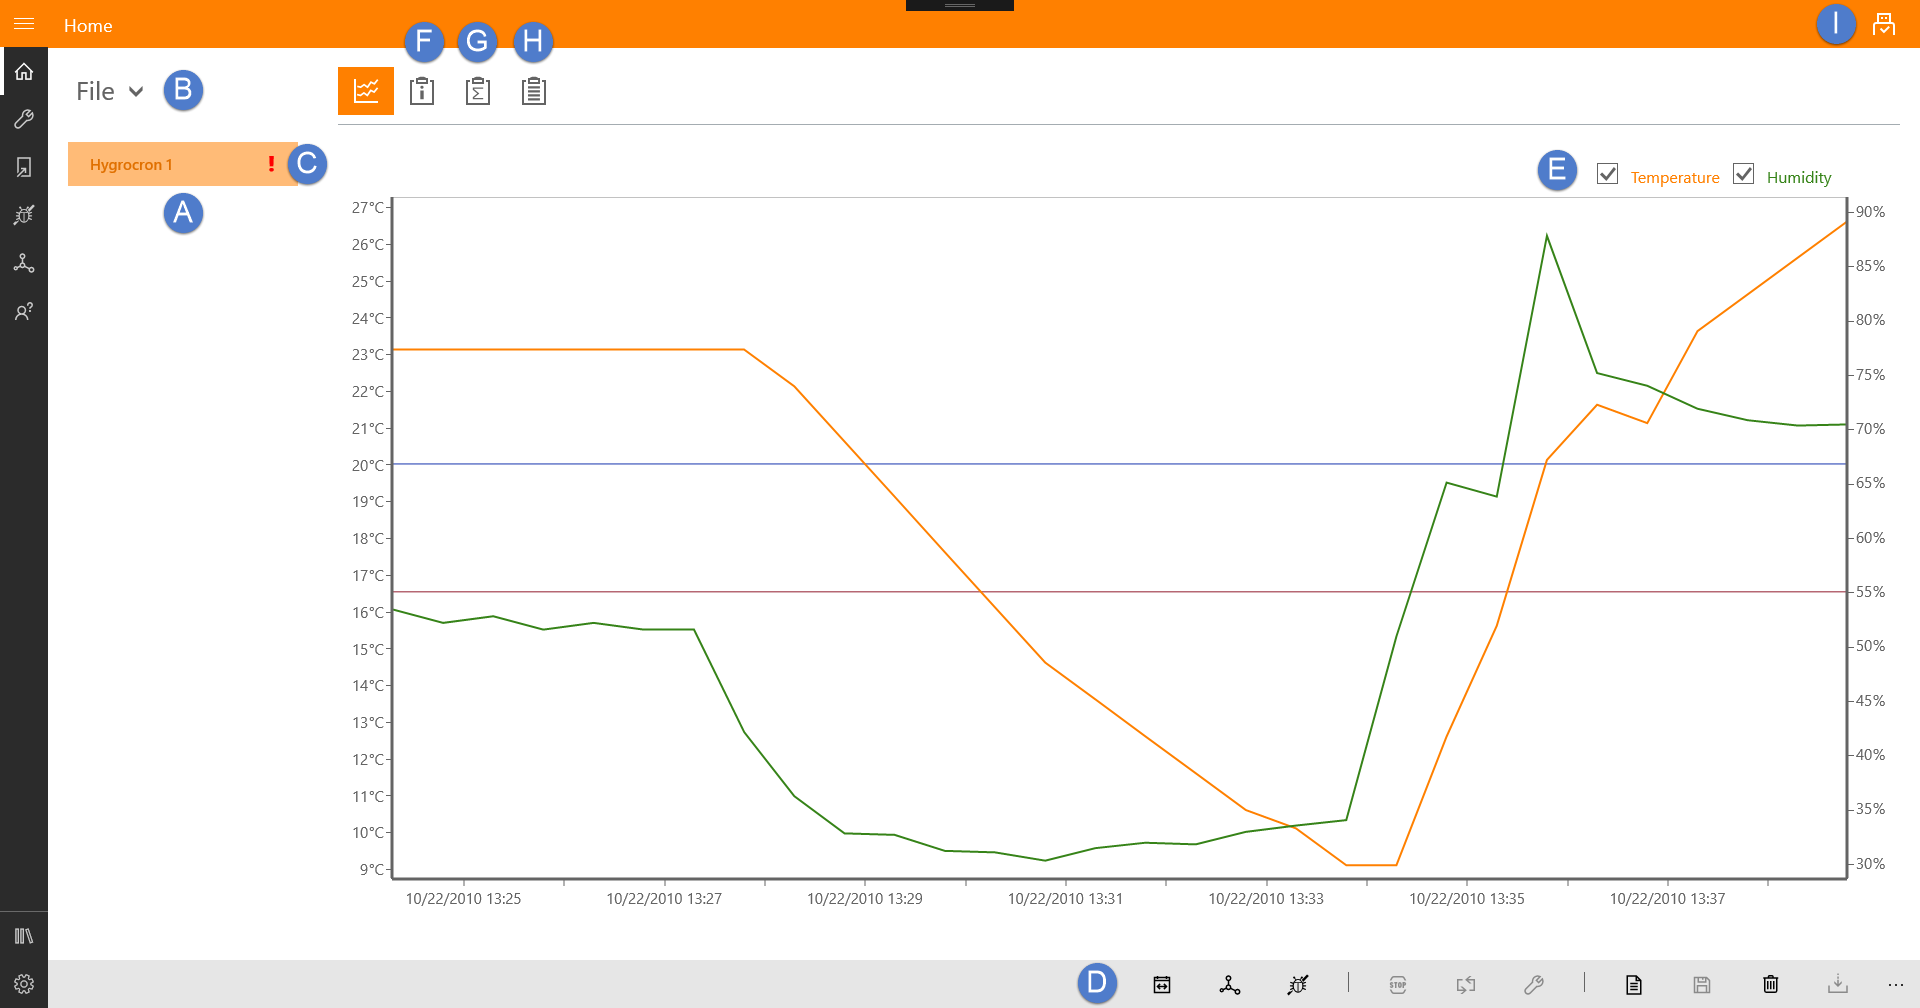
This is the main working screen of Eclo ExpressThermo. This is where you can review the information collected by loggers that you’ve just downloaded and also from data files that you open.
You can navigate through the downloaded loggers or the data files using the respective list that is shown at the left hand side (A).
There is a combo box (B) on the top of the list view to choose which of those two lists is visible.
| If a logger or data file has an active alarm condition, there will be a visual indication next to the logger’s ID (C). |
Commands
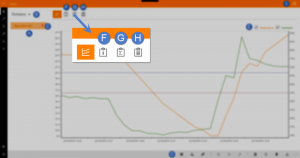
The following commands are available in then command bar, at the bottom of the screen (D):
| Filter log. | |
| Compute MKT, using a profile. Learn more | |
| Plot Heat Treatment curve in the chart, using a template. | |
| Stop log of selected logger. | |
| Reprogram logger with the same parameters. | |
| Navigate to the ‘Program Logger’ page to program the selected logger. | |
| Generate a report for the selected logger. This command will take you to a print preview. | |
| Save selected logger data to an ExpressThermo data file. | |
| Remove the selected logger from the list. | |
| Download data from a logger connected to the interface. |
Chart
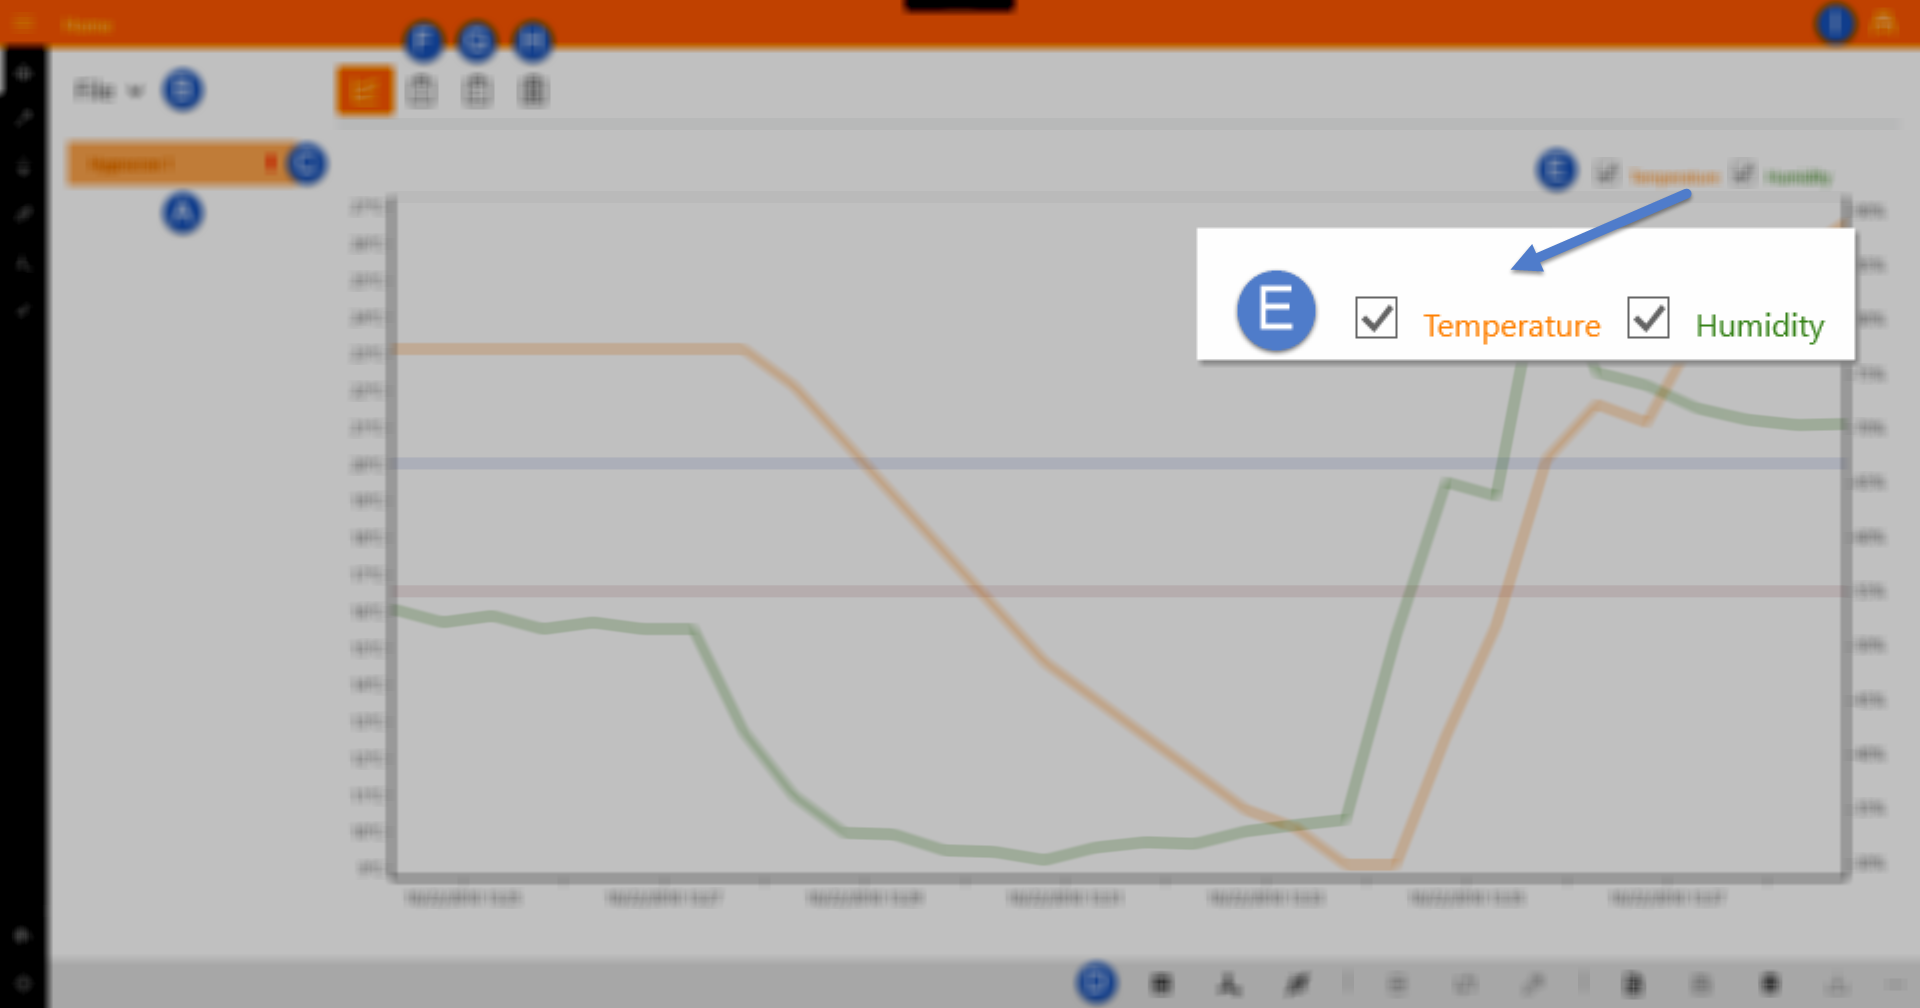 |
On the right hand – occupying a large area – there is a chart with the log of the selected logger. Depending on the available log data, the chart may include temperature and/or humidity. You can show/hide each data set using the check boxes at the top right corner of the chart (E) |
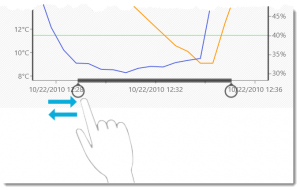
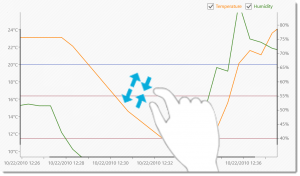
The chart is interactive. You can use both horizontal and vertical chart’s axis to adjust the time interval or the temperature/humidity range using touch (as shown below) or the mouse cursor.
You can also zoom in and out the chart, by pinching or stretching your fingers on the chart, if you are interacting with the chart using touch. If you’re using the mouse, just use the scroll wheel.
More info
In addition to the chart representation, there is more information available about the logger and the log data. You can reach it using the tabs at the top of the screen.
| F | Generic information about the logger such as model, serial number, memory capacity, temperature range and resolution. | |
| G | The parameters that where programmed into the logger along with log statistics. | |
| H | Table view with log readings. This data can be exported to either Excel or CSV according to the format set in Settings » Preferences. |
You can also check the status of the adapter through the icon in the upper right corner of the screen (I).
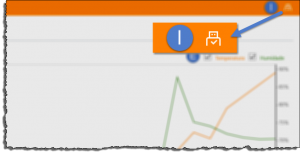
It may display two states:
| Adapter properly installed and connected. | |
| Adapter not connected. If you have the adapter connected to the computer and still it is not detected, it may be because the drivers are not properly installed or it is requiring a restart (you should disconnect the adapter and connect it again). |